How is Figma so performant?
Let me share their secret tool: SpeedScope.
Introduction
Figma is dominating the market in the world of design. It stands out for its ability to deliver a seamless, lag-free experience. But what's the secret behind this performance?
What if?
Think about having a tool that quickly shows where your code is slow. A tool so good at finding performance problems that fixing your code becomes easy. This isn't just a dream. Figma has this tool, and it helps keep the platform fast and efficient.
It's not the answer to everything. But one of their core tools for staying performant.
Introducing SpeedScope
Figma's secret sauce for maintaining its speed is a tool called SpeedScope. While 'secret' might be a bit of a stretch, SpeedScope isn't as widely known as it deserves to be, especially considering its capabilities.
The best part?
It's open-source and free for anyone to use.

What is SpeedScope?
SpeedScope is a browser-based profile visualizer. It takes performance profiles from various sources and turns them into an easy-to-read, interactive visualization. This visualization helps developers understand where their code is spending most of its time, making it easier to pinpoint and resolve performance bottlenecks.
Three views
SpeedScope offers three different ways to visualize what's going on:
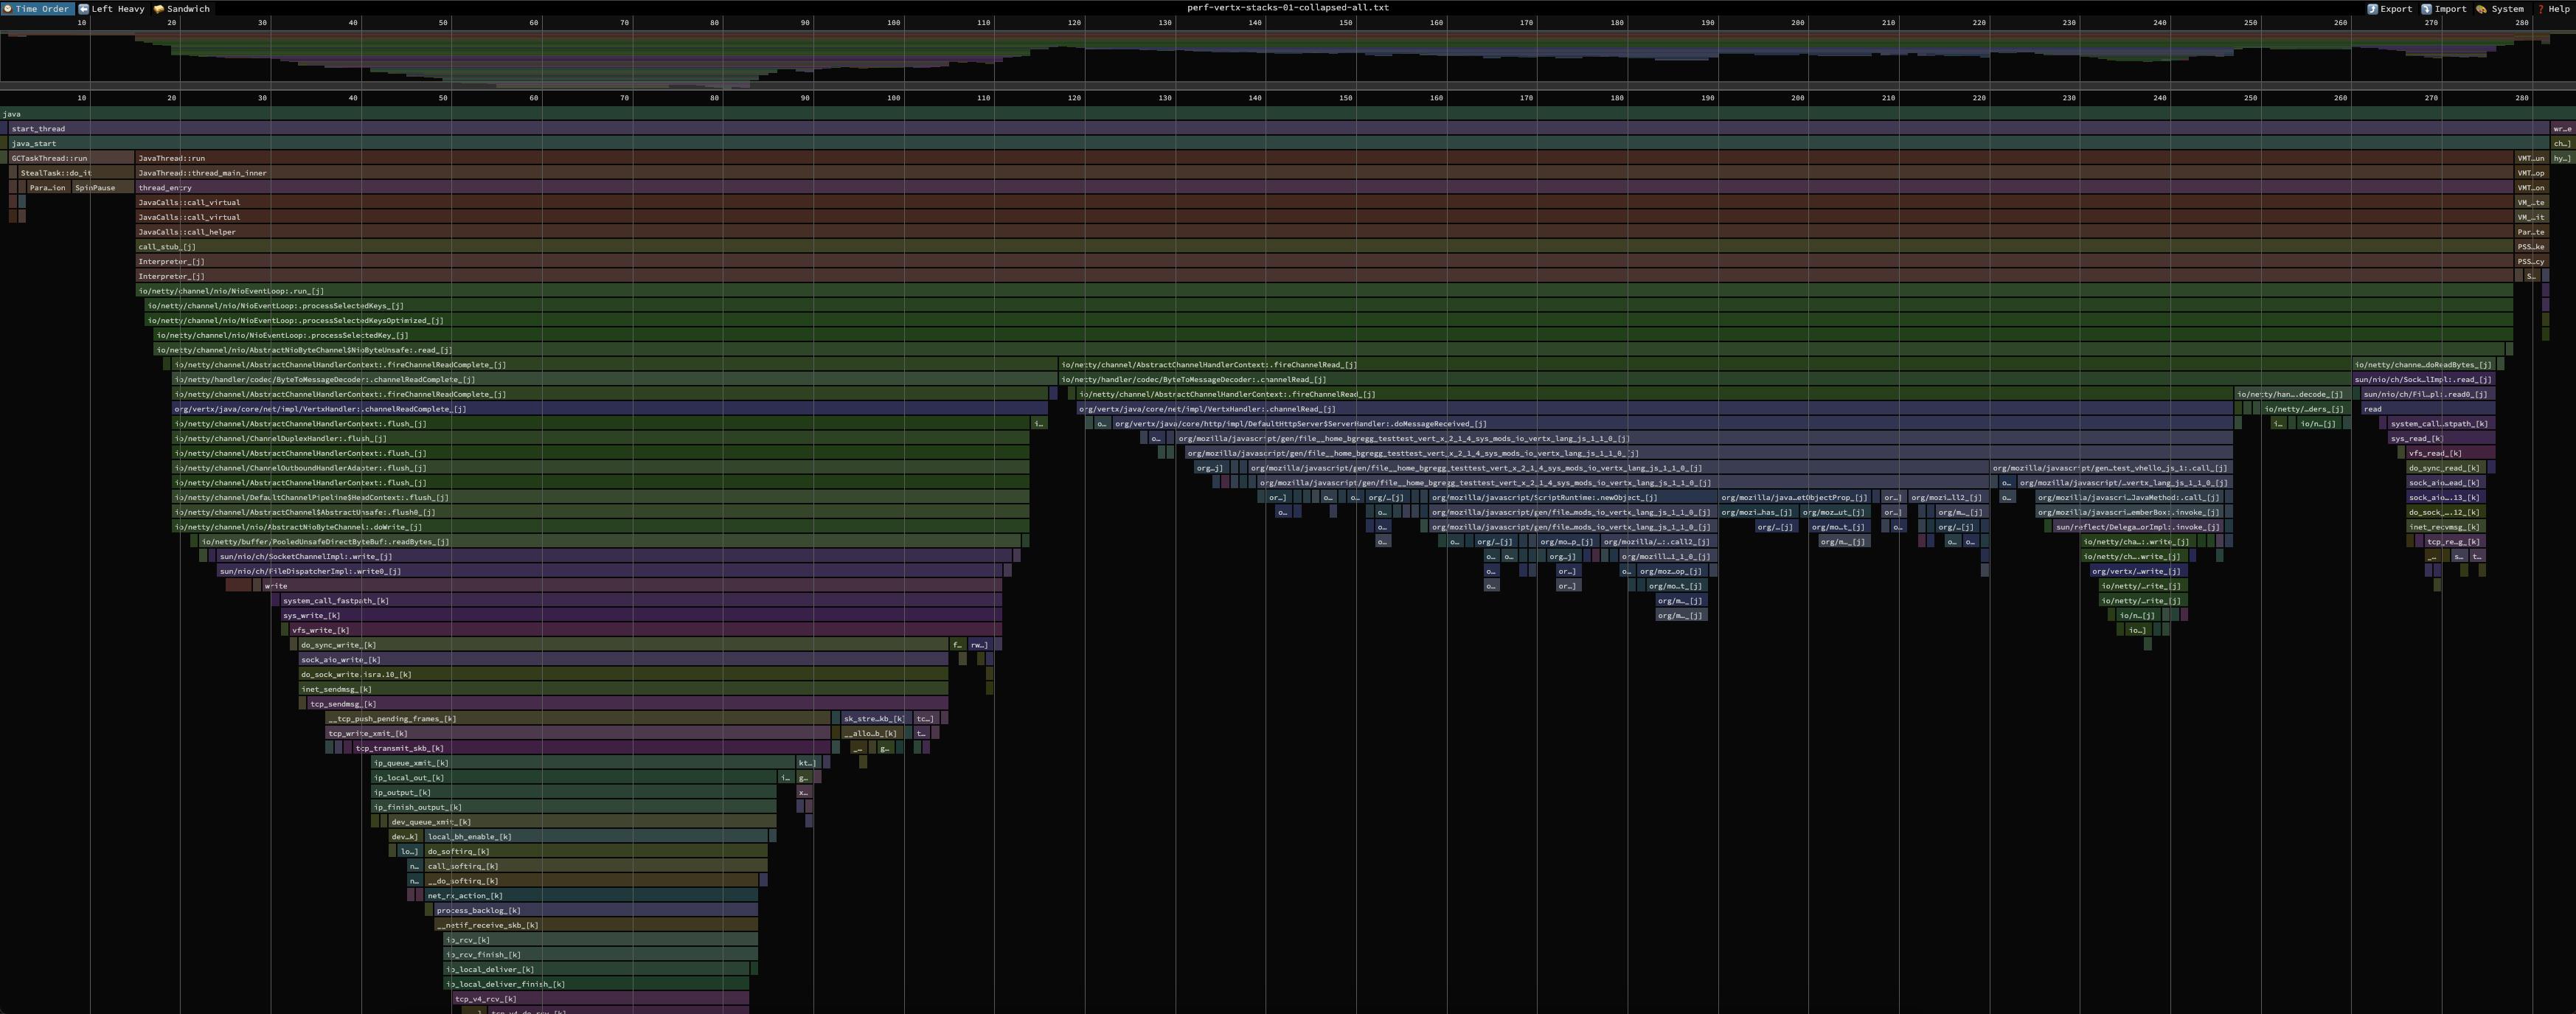
Time Order View: This view shows the profile as a flame graph arranged in chronological order of function calls. It's like watching a play-by-play of your program's execution, helping you see the sequence of events and how they contribute to performance issues.
Left Heavy View: This view organizes profile data based on the total time spent in functions. However, this one is unique! Unlike the time order view, similar stacks are grouped together, regardless of when they occurred. This is the one I want to focus on in this post. It's so phenomenal and the one you'll use the most.
Sandwich View: An approach that combines aspects of both the Time Order and Left Heavy views. It's designed to help you balance between finding what's taking the most time overall (like in Left Heavy) and understanding the chronological flow of your program (as in Time Order).
A practical example with code (Left Heavy)
We're gonna focus on the Left Heavy view. To understand how it works, I've written some Node/JavaScript code that we'll profile.
const analytics = require("./analytics");
const sorting = require("./sorting");
const calculations = require("./calculations");
const dataManipulation = require("./dataManipulation");

function main() {
  console.log("Starting intensive tasks...");
  analytics.runAnalytics();
  sorting.performSorting();
  calculations.runCalculations();
  dataManipulation.manipulateData();
  console.log("Tasks completed.");
}

main();
As you can see, that's the chronological order of the functions called inside main .
When we run the script, we'll generate a .cpuprofile file and drop it into SpeedScope. It's one of the file formats SpeedScope supports.
In Node, this can be done with the --cpu-prof flag. You prepend the flag before running the script.
If you want to follow along, the code can be found here.
We'll go ahead and run node --cpu-prof index.js . Let's drop the generated profile file into SpeedScope.
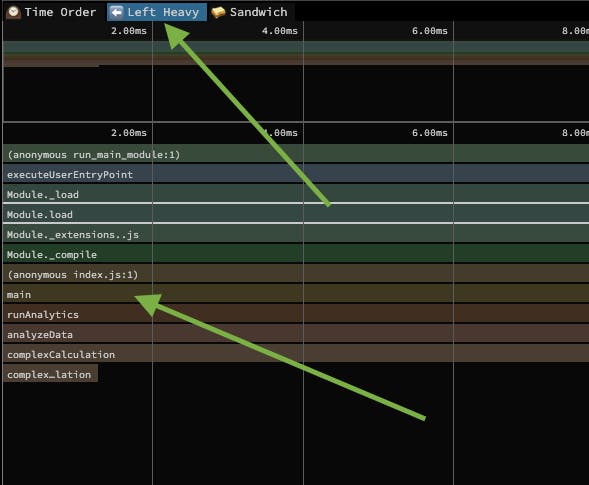
Click on Left Heavy view, you can also see our main function there.

Deep dive

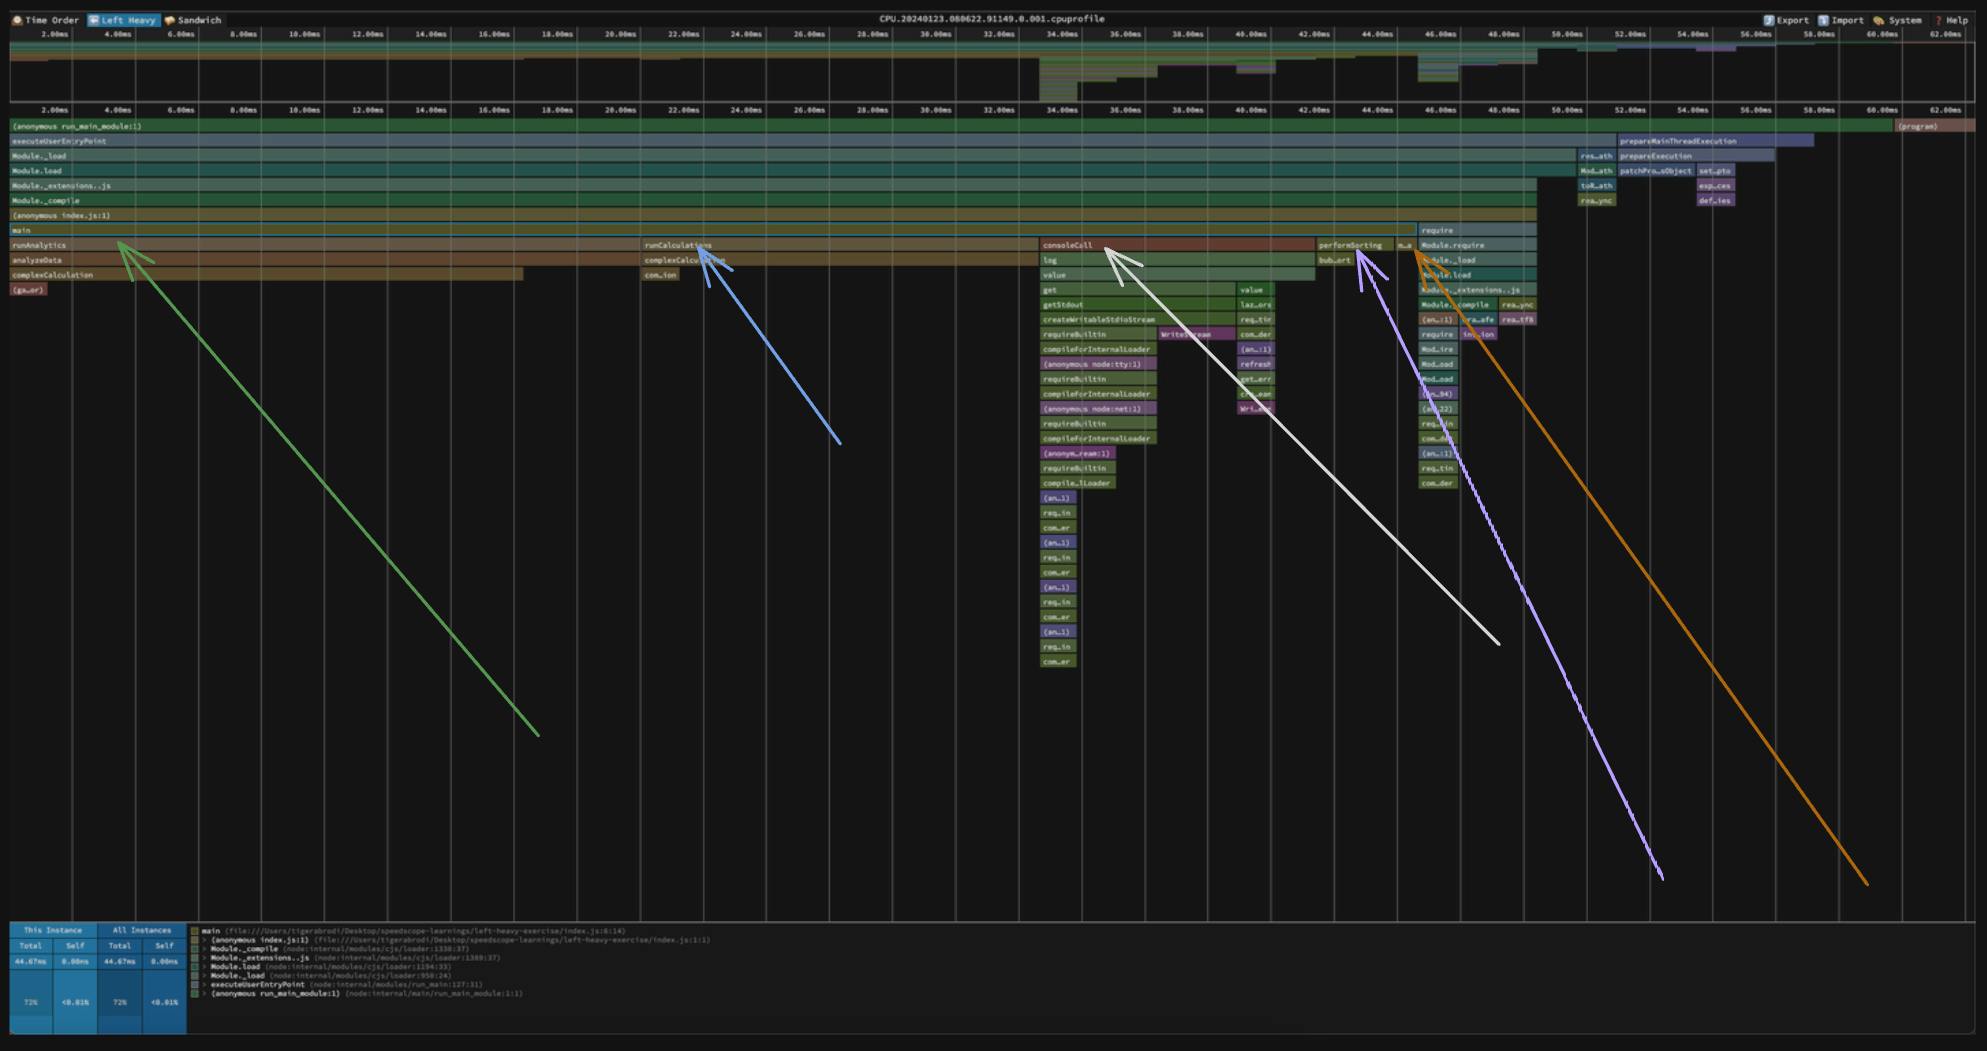
Hover over the different frames. You can see how long it took something to execute and it's percentage of the entire execution.
There is some noise in there because internal node stuff is happening before main is called. But I want you to focus on the main function.
In the image, the arrows point to what's beneath the main function.
If you remember the code, the main function is calling different functions in a specific order.
function main() {
  console.log("Starting intensive tasks...");
  analytics.runAnalytics();
  sorting.performSorting();
  calculations.runCalculations();
  dataManipulation.manipulateData();
  console.log("Tasks completed.");
}
Because we're looking at the Left Heavy view, we don't see the stacks in the order they were called.
The stacks are sorted so that the heaviest stack for each parent is on the left. This view is useful for understanding where all the time is going in situations where there are hundreds or thousands of function calls interleaved between other call stacks.
It's super cool. You can see the parent/child functions and their durations. A parent function might be slow, but it's not always because of the parent function itself. Sometimes, it's because of one of the nested children.
I got a bit excited. Let's go back to the example to not lose ourselves.
If you look at the code, we're calling:
console.logrunAnalyticsperformSortingrunCalculationsmanipulateDataconsole.log
However, the sequence of the frames inside main on SpeedScope is different:
runAnalyticsrunCalculationsconsoleCallperformSortingmanipulateData
Why is that?
Identical stacks are called together. That's why console logs are grouped as
consoleCall.It's sorted from heaviest to least heavy. In other words: From the function that takes the most time to run to the one that takes the least time.
Why is it so cool?
It's really cool because we can easily see which functions take the longest to run. Plus, it shows us the functions that each function calls. This helps us find where things are slowing down.
Just because a function is slow, doesn't mean we have pinned down where things are slowing down. It's often more narrow than just the "function".
Let's look at why I mean a bit closer:

runAnalytics calls analyzeData.
runCalculations calls complexCalculation.
Let's open their code:
// calculations.js
function runCalculations() {
  for (let i = 0; i < 1000; i++) {
    // calls this function
    complexCalculation(i);
  }
}

// analytics.js
function runAnalytics() {
  const sampleData = Array.from({ length: 1000 }, (_, i) => i);
  // calls this function
  analyzeData(sampleData);
}
Even the main function itself calls different functions. We can see the functions it's calling and how much each function costs.
Learning a codebase
SpeedScope can also be useful to learn a new codebase and understand the hierarchy. Run different scripts and see the parent/child functions.
Language agnostic
SpeedScope supports different file formats.
The way I generated the .cpuprofile file, you should be able to do it in other programming languages too.
In Python, you would do something like:
python -m cProfile -o output_file your_script.py
Generate the file. Drop it in SpeedScope. Start analyzing where things are going slow in your app!
Amdahl's Law
Don't get too obsessed about performance.
Software engineering always goes back to customers.
It’s important to not do things blindly.
Making a small part of the system faster may not have an overall effect on the system. It’s easy to fall into traps when focusing on performance optimizations.
Make sure your time is spent wisely as a developer.

Don't get me wrong
I'm not saying you shouldn't dig deep into performance.
But it's important to be aware of the entire picture and our goal as software engineers.
Now, if your work is performance focused, then that's different.
An example is the engineering that goes into Bun.
Which reminds me of this tweet lol


